Product Opportunity Matrix: How to Score and Rank Ideas
Learn what a product opportunity matrix is, how to score ideas on six dimensions, and when the scores mislead you before you build.

You've saved a pile of complaints from Hacker News and Reddit, opened a spreadsheet, and started imagining what you could build. One thread feels especially convincing: the frustration is clear, the comments are enthusiastic, and you understand the technical fix. But is it a better opportunity than the dull invoice problem someone mentioned almost in passing?
A product opportunity matrix helps you make that comparison. The useful version doesn't just assign scores. It keeps the strength of the opportunity separate from the strength of the evidence, so enthusiasm doesn't become your investment case.
Why Ideas Need a Shared Scoring Grid
Say you're a founder sorting through twenty complaints collected from HN and Reddit. You've already picked a favorite, although you haven't admitted it yet. Every new comment about that problem feels like confirmation, while less exciting problems receive a quick glance.
A product opportunity matrix is a grid that evaluates candidate opportunities against the same dimensions, using the same scoring rules. Each row describes a buyer's problem. Each column captures something you need to understand before committing resources.
Think of a nutrition label. Comparing foods is easier when each label presents the same fields in the same order. Your matrix does the same for opportunities: instead of comparing one idea's emotional appeal with another's technical simplicity, you compare frequency with frequency and pain with pain.
What a finished matrix gives you
A useful matrix produces more than an ordered list:
- A ranked shortlist. You can choose which problems deserve validation before discussing features.
- A reason for each ranking. Teammates can challenge the assumptions rather than debate personal preferences.
- An evidence backlog. Some ideas remain unranked because you don't know enough about them yet.
Choose criteria that reflect how buyers make decisions, not just what your team finds interesting. MyMentions' guide to comparison criteria that actually win deals is a useful companion when deciding which buyer-relevant differences belong in your evaluation.
Practical rule: A blank evidence field is a research task, not permission to insert a confident guess.
The matrix isn't a revenue forecast. It doesn't establish market size, prove that someone will buy, or replace conversations with buyers. It organizes what you've learned and makes the remaining uncertainty visible.
Keep the scoring scale simple. A shared scale from 1 to 5 is enough for a working model, provided you define what those scores mean before comparing ideas.
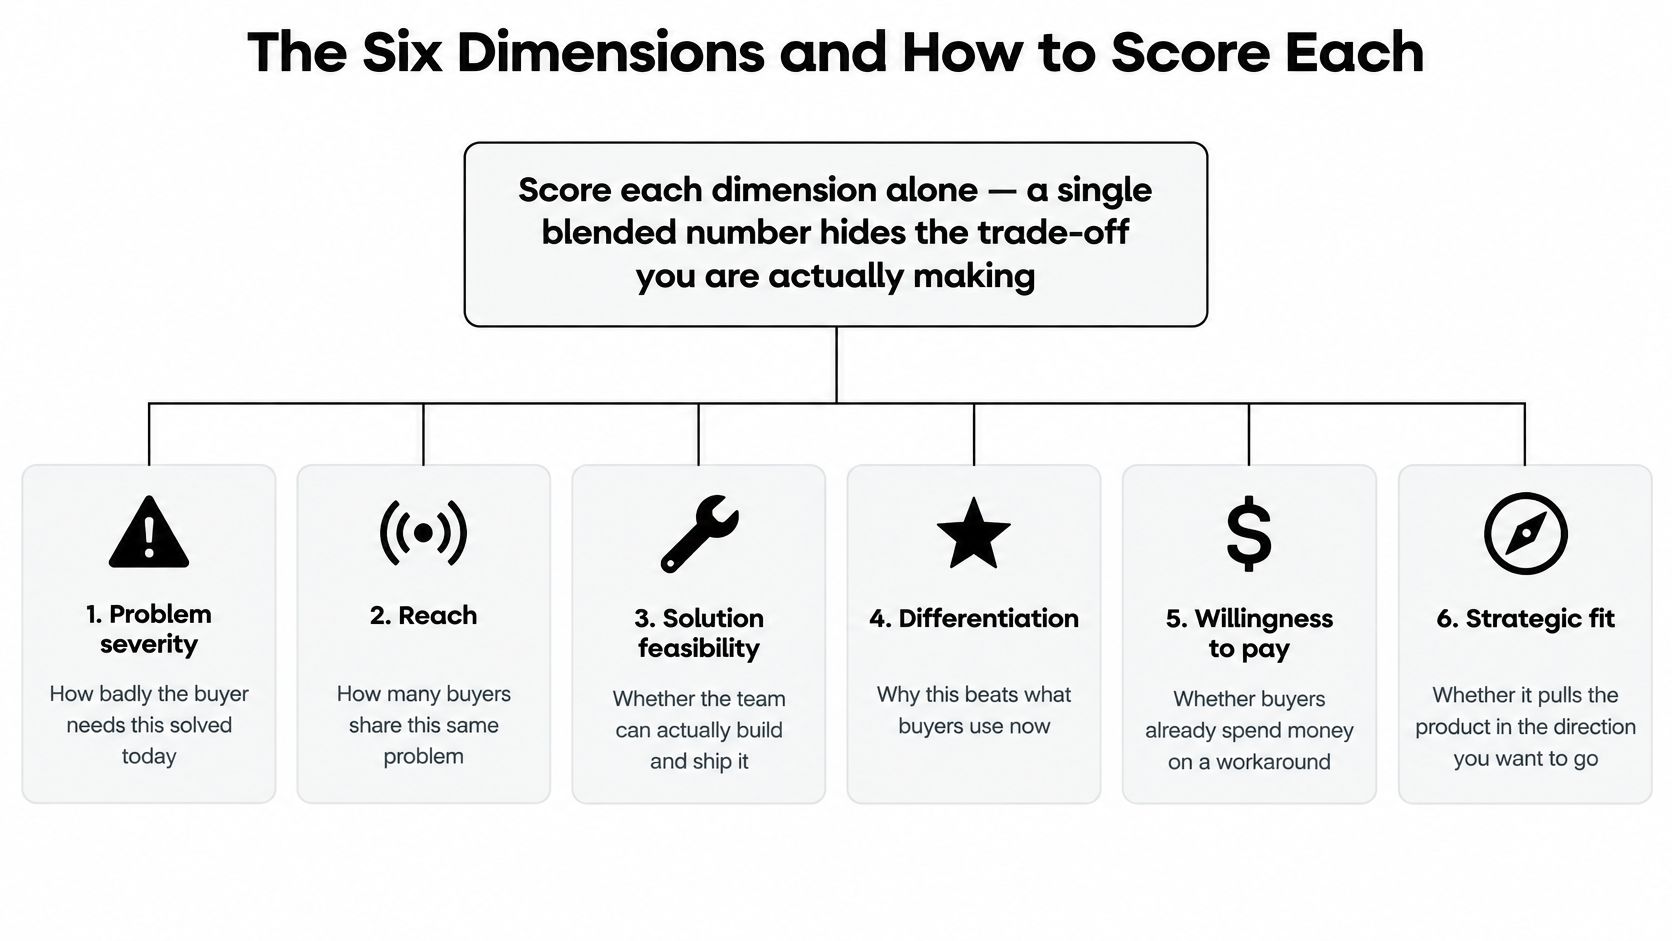
The Six Dimensions and How to Score Each
Score each dimension separately. A problem can happen frequently without hurting much, and an expensive workaround can be difficult to replace. Combining those observations too early hides the decision you're making.
Use these six dimensions as your operating model: problem frequency, pain severity, workaround cost, reach, solution readiness, and willingness to pay or switch. If your initial notes contain proposed features rather than buyer problems, use this guide to identifying customer pain points to sharpen the inputs first.
The diagram offers a broader strategic view. For the working sheet, use the behavioral dimensions and anchors in the table below.
Matrix dimensions with low and high score anchors
These are suggested scoring anchors, not industry benchmarks.
| Dimension | Question it answers | Score 1 | Score 5 |
|---|---|---|---|
| Problem frequency | How often does it occur? | Rare, no clear pattern | Recurring weekly or daily, observed directly |
| Pain severity | What does each occurrence cost? | Minor annoyance | Lost revenue, hours or compliance risk |
| Workaround cost | What do people spend to cope today? | Nothing, they tolerate it | Paid tools, staff time or manual processes |
| Reach | How many people share the problem? | A handful of users | A large, reachable segment |
| Solution readiness | Can a small product address it in weeks? | Needs major new technology | Known patterns and existing building blocks |
| Willingness to pay or switch | Would people pay or change tools? | No sign of interest | Prior purchase or tool switch observed |
Frequency concerns recurrence, while severity concerns the consequence of each occurrence. A daily formatting annoyance can score highly on frequency and poorly on severity. A rare failure that prevents a business from collecting payment can have the opposite profile.
Workaround cost captures what people already sacrifice. Include spreadsheet maintenance, duplicate entry, checking work, and coordinating staff, not just software subscriptions. Reach requires a plausible way to contact the relevant buyers, rather than a broad category such as small businesses.
For solution readiness, assess the smallest useful intervention, not your imagined finished platform. For willingness to pay or switch, look for commitments and past behavior rather than compliments.
Keep score and confidence separate
Treat 1 as a low-end anchor, including rare occurrence or no demonstrated interest, and 5 as a strong condition backed by direct observation where possible. But don't confuse missing evidence with a weak opportunity. Leave an unknown score blank, or mark a required placeholder as provisional.
Buyer access and pricing also deserve scrutiny. Wispra's 4Ps marketing breakdown offers a complementary lens for considering product, price, distribution, and promotion.
Every score needs a neighboring source note and confidence label. Record what supports the judgment, not merely who entered it.
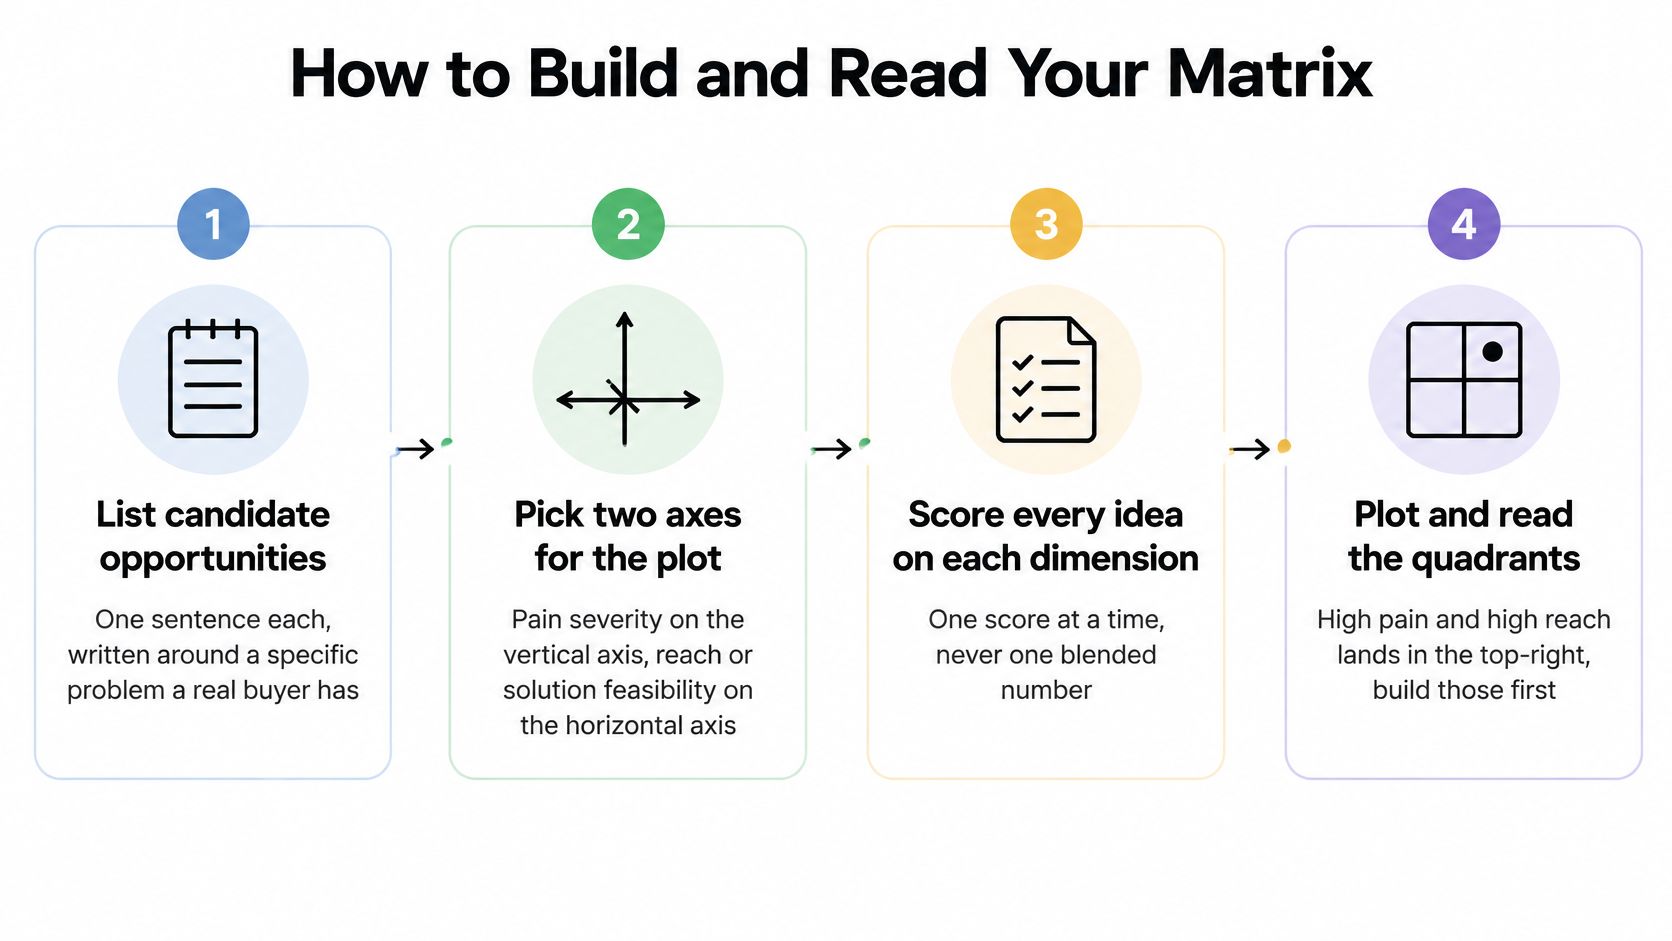
How to Build and Read Your Matrix
Build the working sheet in Google Sheets or Excel before worrying about presentation. Keep the full evidence record there, then use a simple plot to make the shortlist easier to discuss.
This overview captures the basic workflow. Treat the top-right quadrant as a validation queue, not an instruction to start building.
Build the working sheet
Write each opportunity as a buyer problem. Name the person, the task, and the consequence. An operations manager re-entering invoice details is specific enough to investigate; an AI finance assistant is a proposed solution.
Choose the plotting axes. Put pain severity vertically and reach horizontally when choosing a market opportunity. Use solution readiness horizontally instead when your immediate constraint is what the team can deliver.
Score each dimension independently. Beside every score, record an interview note, forum permalink, workflow recording, or exported spreadsheet. Add a confidence label such as observed, corroborated report, or untested assumption.
Plot the candidates. In this suggested model, treat scores of 4 or 5 as high, 1 or 2 as low, and 3 as a middle band. Keep middle-band opportunities near the boundary instead of forcing a sharp distinction.
Flag single-source candidates. Mark an opportunity provisional when its case rests on one source, even if that source contains enthusiastic comments. Several replies repeating the original complaint don't necessarily establish independent demand.
Order the strongest candidates by workaround cost. Within the high-pain, high-reach group, investigate expensive existing workarounds first. They indicate resources already being committed, although they don't prove those resources can become your revenue.
Read the quadrants as different assignments
| Position | Appropriate next action |
|---|---|
| High pain, high reach | Validate the buyer's commitment |
| High pain, low reach | Investigate a focused niche and acquisition route |
| Low pain, high reach | Park unless delivery and distribution are unusually straightforward |
| Low pain, low reach | Deprioritize |
| Provisional evidence | Gather the missing evidence before ranking confidently |
Don't discard a specialized business problem solely because its reach is limited. A reachable niche with meaningful consequences calls for a different commercial model than a widespread inconvenience.
Use the accompanying video as an additional walkthrough while keeping your own evidence sheet open.
The plot is a conversation aid. Keep the underlying dimensions visible so that a convenient position on the chart doesn't conceal an unresolved weakness.
A Worked Example Scoring Three Ideas
Consider a hypothetical shortlist: invoice reconciliation, packing-list preparation, and a confusing onboarding screen. All observations, counts, and scores in this example are invented to demonstrate the method, not presented as market findings.
Start with reconciliation. An operations manager compares invoices between QuickBooks and Xero each week, checks mismatched records, and maintains a shared spreadsheet. In this scenario, three interviews describe the same pattern, and the spreadsheets show the repeated work.
The task involves the kind of side-by-side checking pictured below.

Compare behavior before attention
The packing-list idea concerns a small shipping business. Staff prepare lists daily using homegrown checklists; three hypothetical interviews and a sample export reveal preparation and correction work. Assume separate prospect research has also identified reachable segments for both operational problems.
The onboarding complaint looks different. A viral thread contains strong emotion, but the commenters mostly abandoned the product. Nobody describes buying an alternative specifically to solve the screen-level problem or maintaining a costly workaround.
Three illustrative ideas scored on the matrix
| Idea | Frequency | Workaround cost | Evidence | Quadrant |
|---|---|---|---|---|
| Reconciling invoices between two accounting tools | Weekly | Several staff hours each week | Three interviews and shared spreadsheets | High pain, high reach |
| Packing list for a small shipping business | Daily | Staff time every shift | Three interviews and a sample export | High pain, high reach |
| Confusing onboarding screen from a viral thread | Occasional | Little, users simply left | One viral thread only | Vivid but weak evidence |
For this exercise, assign reconciliation pain 4, reach 4, and packing lists pain 4, reach 4. Their frequency scores might differ, but both enter the high-pain, high-reach group under the suggested plotting rules.
Leave the onboarding idea's reach unconfirmed. Discussion volume doesn't establish how many reachable buyers experience a commercially important problem.
Choose the next question
The operational ideas still need different checks. Reconciliation requires access to suitable accounting records and a reliable way to handle exceptions. Packing-list preparation requires understanding whether the existing shipping software already offers an overlooked solution.
Technical delivery matters too, but shipping the interface isn't the same as solving the workflow. LetsDeployIt's deployment service guide is relevant when assessing the delivery work behind a testable application, not when establishing demand.
The quieter opportunity earns attention because someone can show you the work, the repetition, and the cost.
Replace these illustrative rows with your own findings. The example's ranking depends on its stated assumptions, especially buyer reach.
Where Matrix Scores Mislead You
A score of 3.7 versus 3.5 can look decisive while resting on judgments that nobody has tested. Decimal places don't make interview notes more reliable. A tidy total can conceal uncertainty more effectively than an untidy evidence sheet.
The Carnegie Mellon customer-discovery guide recommends investigating how often a problem occurs, what triggers it, and what the workaround costs. Those are separate questions. Preserve their answers separately rather than compressing them into a single impression of demand.
Averages hide the business you're choosing
Consider a hypothetical comparison: one idea has reach 5 and pain 1, while another has reach 1 and pain 5. Both average to 3, but they require different strategies.
The first might need extremely cheap distribution and almost effortless adoption. The second might support a specialized service, provided the buyer is accessible and the economics work. An equal average doesn't establish equal attractiveness.
Use totals only after examining the component scores. If the team disagrees, identify whether the disagreement concerns the evidence, the scoring anchor, or the importance of the dimension. Those require different resolutions.
Your sample can distort the result
HN and Reddit are useful places to discover language, triggers, and possible interview participants. They're not automatically representative samples of the people who would buy your product.
An articulate technical user may describe a complex edge case in unusually persuasive terms. Meanwhile, someone managing a repetitive spreadsheet process may never post publicly about it.
- Recruit beyond posters. Include non-users, people who rejected existing tools, and staff using manual processes.
- Ask for recent behavior. Request a walkthrough of the last occurrence and inspect the artifacts it produced.
- Distinguish preference from commitment. A statement that someone would switch is weaker than evidence that they have migrated tools or allocated resources.
- Flag anecdote-only scores. Keep them visible without treating them as established rankings.
Evidence test: Can another person trace the score back to something the buyer actually did?
Sometimes scoring isn't the best next action. If you can't identify a reachable buyer group, investigate access before polishing the grid. If a decision is cheap to reverse and a simple experiment would answer the question directly, run the experiment instead.
Adding a Time Layer for Changing Markets
A promising opportunity today may be less attractive by the time you can deliver it. Add a time layer to shortlisted ideas so you're evaluating a changing situation rather than preserving an old snapshot.
Record current pain, expected direction, and the mechanism behind that expectation. A platform announcement, a customer's migration plan, or a newly available integration is more useful than a general prediction that AI will change everything.
Separate a forecast from an observation
Keep a small change log beside the matrix:
| Time-layer field | What to record |
|---|---|
| Current pain | The workflow and consequence observed now |
| Expected direction | Increasing, stable, declining, or unknown |
| Change driver | The specific platform, AI capability, rule, or buyer change |
| Reversibility | What you could reuse or abandon after a wrong decision |
| Cost of waiting | The access, learning, or commercial opportunity delayed |
| Evidence freshness | Source, observation date, and next review trigger |
Treat future conditions as hypotheses. If you expect a platform feature to remove the problem, record whether the feature is announced, available, or adopted by your target buyers.
For a structured way to investigate alternatives and buyer access, use this guide to market research for startups.
Distinguish underserved from unserved
Underserved buyers already have a solution, but it falls short. Their spreadsheet may be frustrating while still containing valuable history, familiar routines, and approval controls. Your product must justify migration as well as improve the task.
Unserved buyers have no workable solution. That doesn't automatically make them attractive customers: they may tolerate the problem because its consequences are small.
A high-pain idea can remain weak when the workaround is cheap and established behavior is difficult to change. A moderate problem can become worth testing when buyers gain easier access, integration becomes simpler, or a change makes the task more frequent.
Date each forecast and name what would overturn it. Revisit the time layer when that trigger occurs, rather than updating the scores merely because the spreadsheet has been open for a while.
Decide Which Idea to Validate First
Take the strongest supported candidate and write its problem in a sentence naming a real buyer: an operations manager loses time reconciling invoices because records don't match across accounting tools. If you can't write that sentence clearly, return the idea to the provisional list.
Validation means obtaining money, time, or a clear yes from real strangers before building, not collecting encouragement from friends or coworkers. Ask a relevant buyer to provide an export for a manually delivered reconciliation test, book a working session, or make a paid commitment to a clearly described offer.
Run a bounded test
Use a landing page or manual service with a fixed decision deadline. Our idea validation framework sets out a process for testing the commitment before developing the complete product; keep the budget below $200 and make the final decision within 14 days.
Define what would justify continuing before launching:
- Build. Buyers commit, the workflow is deliverable, and the economics warrant further work.
- Iterate on one variable. Evidence points to a specific issue with the audience, offer, price, or acquisition route.
- Move on. The test doesn't produce the commitment needed to justify another investment.
The Aha! guide to continuous product discovery emphasizes ongoing customer learning, observation, alternatives, and iterative validation rather than a one-time ranking exercise.
After the test, replace assumptions with what happened. Update the affected scores, preserve the source notes, and reconsider forecasts when new evidence changes their basis. Your best next opportunity is the one you can justify testing, not the one with the most polished score.
Find Startup Idea collects startup ideas from real HN and Reddit pain points, giving you candidates to investigate rather than a blank spreadsheet. Visit Find Startup Idea, shortlist problems you understand, and build an evidence-linked matrix before choosing your first validation test.