What Is Willingness to Pay? a Practical Guide for Startups
What is willingness to pay? Learn how to measure it with surveys and price tests, and how startups can use it to set prices customers accept.
A buyer may say a product is worth a higher price, then choose a cheaper option at checkout. That gap is why willingness to pay is best treated as a signal to test, not a price to trust.
A survey answer can reveal interest, but it does not show what someone will sacrifice to buy. A shopper might praise sustainably sourced goods and still leave them on the shelf when the price is real.
For founders, the useful question is what people do when asked to pay. Stated willingness to pay offers a starting point; purchase behavior shows whether the offer and its price hold up in practice.
What Willingness to Pay Means
Willingness to pay (WTP): the maximum amount of money a buyer would give up to obtain a particular good, service, improvement, or outcome while maintaining the same level of utility.
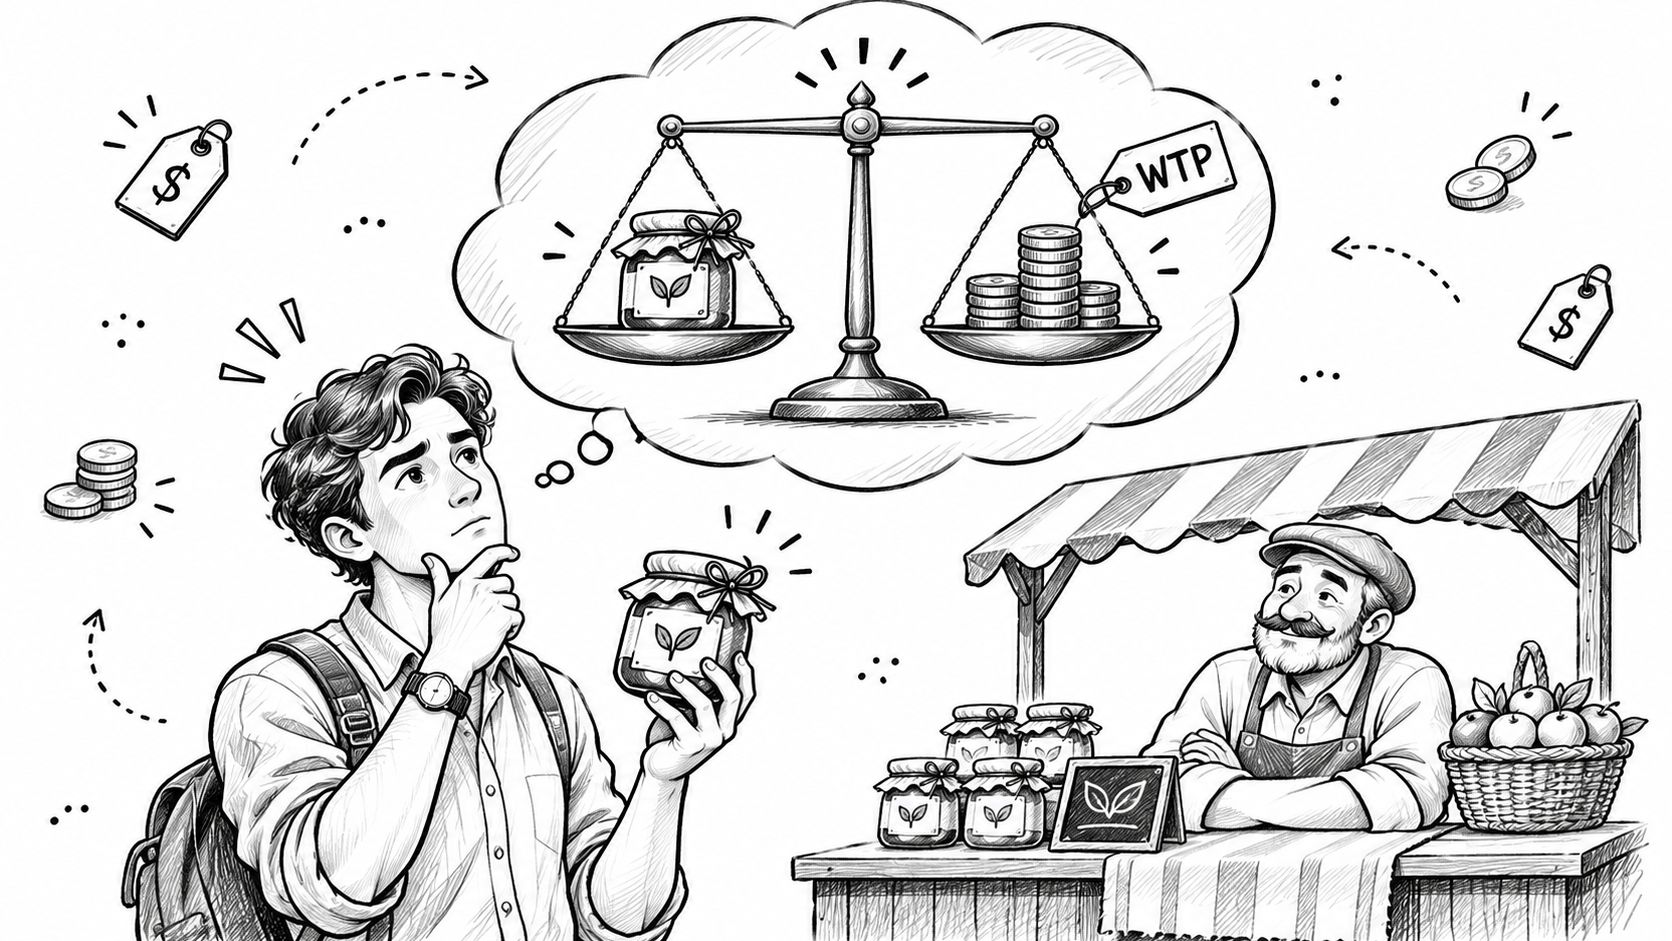
Start with a commuter. She'd pay $5 for the bus into town. At $8 she drives, or she stays home, or she takes the slower route with two changes. Her willingness to pay for that ride is $5, and everything above $5 is the zone where the trip stops being worth it. The bus company can run a full schedule and still lose her if it prices at $6.
If the phrase what is willingness to pay has felt abstract until now, that fare is the whole idea: one ceiling, in dollars, for one specific offer.
The Food and Agriculture Organization's guide to valuing benefits makes the sharper point. WTP measures the economic value a buyer assigns to an offer, not whether the buyer likes it. A reader can love a magazine and still cancel at $14 a month. Affection and price tolerance live in different rooms, and confusing them is how founders end up discounting a product people admire.
Willingness to accept is the mirror image
Economists draw a second line worth knowing. Willingness to accept (WTA) is the minimum compensation a person would require to give up something they already hold. The same FAO guide treats the two as counterparts in cost-benefit analysis, and the counterparts rarely match. People demand more to surrender a thing than they would pay to acquire it. Ask a ticket holder "would you pay $200 for this seat?" and then "would you sell it back for $200?" and you'll get two different people's answers from one person.
You read the number in one of two ways, depending on whether a market exists:
- A market already exists. Infer WTP from revealed behaviour, meaning the prices and quantities people buy at. Your competitors' published prices and your own past transactions are data.
- No market exists yet. Estimate it with a stated-preference survey that describes a scenario and asks whether the respondent would pay a set amount. Useful, cheap, and easy to over-trust.
Every buyer has a ceiling. Pricing is the work of finding where those ceilings cluster, then building plans around the clusters.
Why Willingness to Pay Sets Your Price
A price can fail in two directions. Set it above most ceilings and buyers walk, so you learn nothing about demand. Set it below them and buyers stay while you fund their discount out of your own margin. The band between those failures is narrower than most founders expect.
Run the arithmetic on a simple case. It's illustrative, but the shape repeats in real launches. You have 100 qualified prospects whose ceilings spread evenly from $10 to $60 a month. At $10, all 100 buy and you collect $1,000. At $20, 80 buy for $1,600. At $30, 60 buy for $1,800. At $50, 20 buy for $1,000. The revenue peak sits at $30, a price that wins 40% fewer customers than the cheapest option and still earns nearly twice as much.
That's the first lesson willingness to pay teaches. Volume and margin pull in opposite directions, and the answer usually sits in the middle of the spread rather than at either end of it.
One number rarely fits every segment
A freelancer, a mid-size agency and an enterprise team will value the same tool differently, and not by a few percent. Tiered plans exist because a single price undercharges the top segment and prices the bottom one out entirely. Each tier is a bet that a cluster of ceilings sits in a particular band.
If you sell placements rather than software, the same logic shapes how you build tiers, and the DirectoryEasy premium listing pricing guide works through setting them against what each advertiser segment will bear.
The spread also has a floor. When a segment's ceiling sits below what it costs you to serve them, marketing can't close the gap. Advertising moves a buyer within their range of tolerance; it can't lift that range above your cost line for long.
Copying a competitor's price imports three things you didn't measure: their cost structure, their customers' ceilings, and their positioning. None of them are yours.
- A cheap price can signal weak quality. A buyer who doesn't yet trust you reads a very low number as evidence that something is missing, and discounts the offer before trying it.
- Proof lifts the ceiling. The same buyer accepts a higher number after seeing a case study, a guarantee or an independently verified claim, which means your price is partly a function of how much evidence you've assembled.
Before you touch a price tag, answer two questions. What would this group pay today to solve this problem, and what are they already paying for the alternatives? The second answer anchors the first.
How to Measure Willingness to Pay
Six methods cover nearly every practical situation. The table is the reference; the paragraphs after it explain what each one is good for.
| Method | What It Shows | Main Limit |
|---|---|---|
| Van Westendorp price sensitivity | Acceptable price range from four questions on cheap, bargain, expensive and too expensive | Hypothetical answers with no commitment to buy |
| Gabor-Granger | Share of buyers who would buy at each price on a ladder, forming a demand curve | Order of the price ladder can shape answers |
| Contingent valuation | Stated WTP for a clearly described change, often per person | Hypothetical bias; needs careful survey design |
| Conjoint analysis | Value of features and trade-offs with price as one attribute | Complex design and a large sample needed |
| A/B price test | Real conversion at each price on live traffic | Needs enough traffic; buyers seeing different prices can damage trust |
| Preorder or paid pilot | Real money committed before the product is built | Small sample and slow to run |
The top four ask people what they would pay. The bottom two watch what they do.
Stated methods
Van Westendorp asks four questions about a product: at what price is it so cheap you'd doubt it, at what price is it a bargain, at what price does it start to feel expensive, and at what price is it too expensive to consider. Plot the four answer curves and the crossings mark the range most respondents find acceptable. It's fast, it's qualitative in feel, and nobody in it spends a cent.
Gabor-Granger walks a ladder. Respondents say whether they'd buy at each price in sequence, and the yes share at each rung traces a demand curve. Because the sequence is visible, the first price a person sees colours every answer after it.
Contingent valuation describes a clearly defined change and asks for a stated value, often per person, which is the standard tool when no market price exists for the thing being valued.
Conjoint analysis shows respondents bundles of features at different prices and asks them to choose. Price is one attribute among several, so you learn what a feature is worth and what it costs you in price tolerance. It needs careful design and a sample in the hundreds.
Revealed methods
An A/B price test splits live traffic, shows each visitor one price, and compares conversion. It gives you behaviour instead of opinion, provided each arm gets enough traffic to separate a real difference from noise, and provided you're ready for the buyer who compares notes with a friend and finds a different number.
A preorder or paid pilot asks for money before the product exists. Small sample, slow to run, and the most convincing evidence you'll get at an early stage.
Working rule: use stated methods to narrow the range, then confirm with a revealed method before you commit to a price.
If you're still deciding what to research and in what order, our guide to market research for startups lays out the sequencing.
How to Read Willingness to Pay From Survey Data
A survey gives you raw answers. Turning them into a candidate price takes one multiplication and a chart.
Take an illustrative run: 100 prospects asked whether they'd buy at four prices. Ninety say yes at $10, 60 at $20, 35 at $30 and 15 at $40. Multiply buyers by price to see what 100 prospects would spend: $900 at $10, $1,200 at $20, $1,050 at $30 and $600 at $40. The best rung on this ladder is $20, even though $10 sold to twice as many people. That's the correction most first-time founders miss. The lowest price is rarely the best price.
Read the share at each price as the share of buyers whose ceiling sits at or above it. That's why the line falls as the price climbs, and why a flat line means your questions were too vague to separate anyone.
From answers to a candidate price
- Build a four-point ladder from interviews. Bracket the range you heard, space the rungs evenly, and resist clustering them around your preferred price.
- Rotate the order. Shuffle which price each respondent sees first, because a fixed sequence primes every answer after it.
- Multiply and plot. Buyers times price at each rung, then draw the curve.
- Mark two landmarks. The revenue peak is your candidate price; the rung where interest collapses is your practical ceiling.
- Discount the whole curve. Stated answers land above real purchases, so treat the peak as an upper bound to test rather than a price to print.
What you want out of this is a range you can defend to a colleague, not a decision you have to defend alone.
Stated Versus Revealed Willingness to Pay
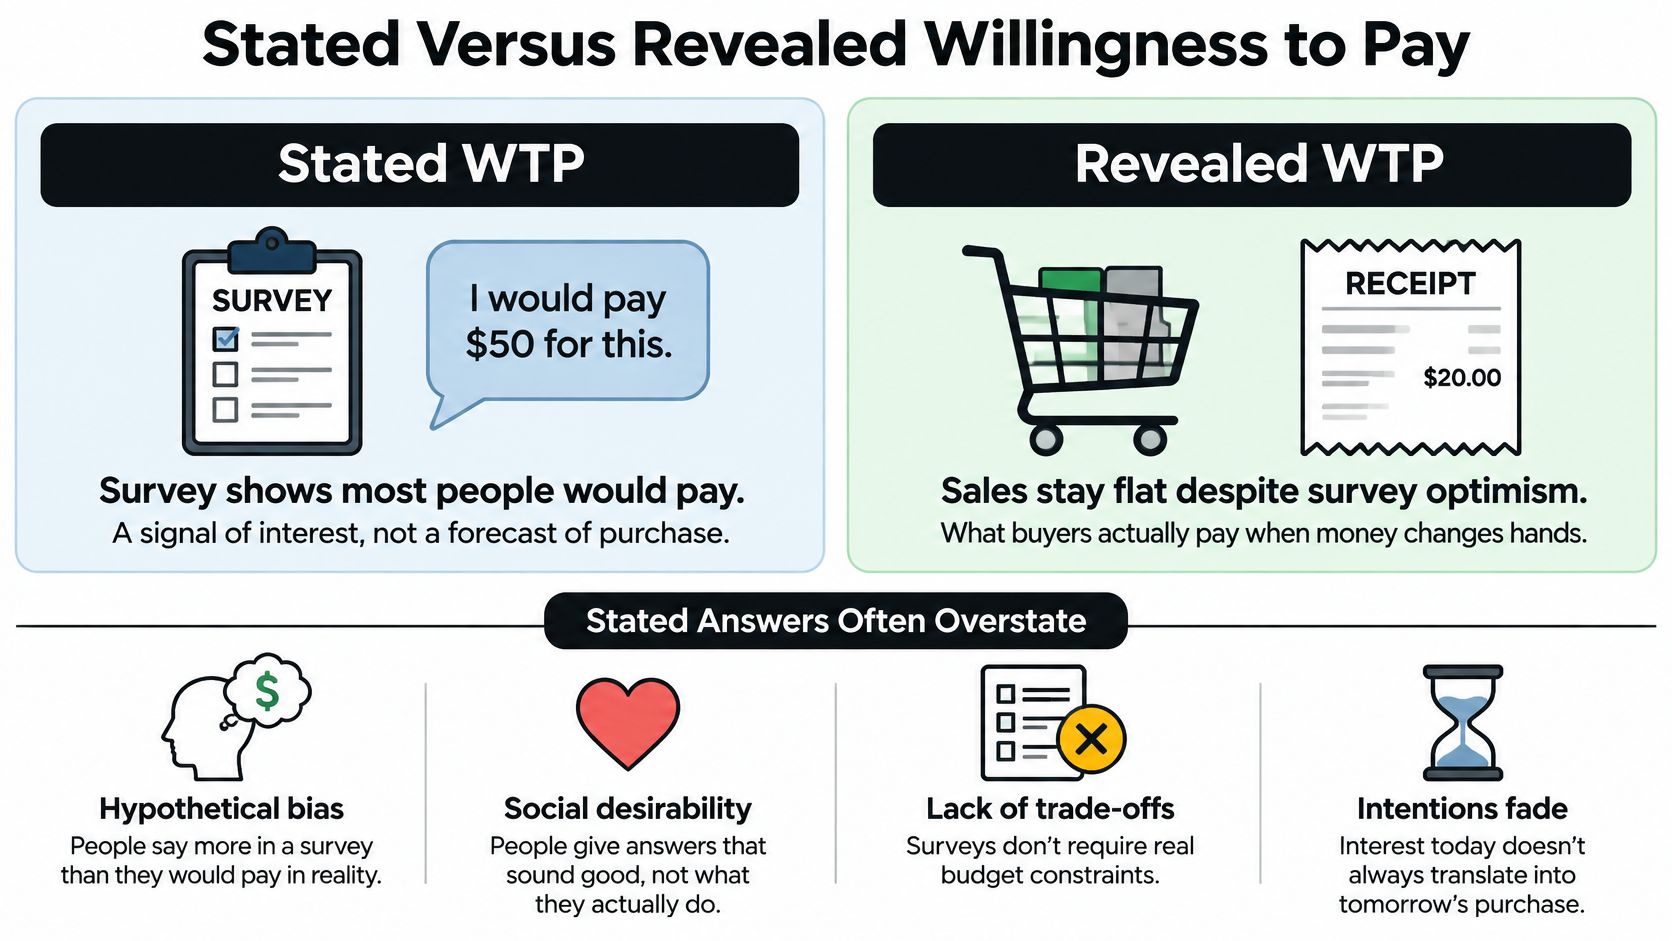
Thirty interviews, thirty heads nodding at $30 a month, then two people enter a card. Founders read that as failure. It's closer to the normal ratio between what people say and what they do, and it's the reason customer discovery interviews are a starting point rather than a verdict.
Why stated answers overstate
Stated willingness to pay is a number given for a hypothetical purchase, and four things inflate it. The stakes are imaginary, so a yes costs nothing. The interviewer is pleasant to agree with. A wrong answer carries no consequence. And the question itself shapes the reply, because "would you pay $30?" invites agreement while "at $30, do you buy today or not?" invites a decision.
Revealed willingness to pay is the number attached to an actual transaction: a completed checkout, a deposit, a paid pilot, a signed order. It costs the buyer something, which is why it's worth more to you.
| Stated WTP | Revealed WTP | |
|---|---|---|
| What it measures | An answer to a described scenario | Money that actually moved |
| Cost to run | Days of interview time | A real offer and a small budget |
| Cost to the buyer | Nothing | Money or a firm commitment |
| What to do with it | Narrow the range | Set the price |
Surveys do show the shape of a ceiling even when the level is inflated. In 2024, Bain found that 40% of global consumers were willing to pay more than a 2% premium for residential electricity linked to emissions reductions, while fewer than 20% accepted a premium above 10%. Notice how fast the numbers fall. Even in a category where people say they care, the ceiling arrives within a couple of percentage points.
What an incentive-compatible test looks like
Give the answer a consequence. Put a real price on a real page, ask for a card, and take a deposit or a preorder at the price you intend to charge. A paid pilot does the same job for a business buyer: a small invoice, a defined scope, and a start date.
Three corrections to carry into that test:
- A yes is not a reservation price. It's interest with a number attached.
- Enthusiasm at a low price tells you nothing. Everyone is enthusiastic about $5.
- A discount reveals quantity, not a ceiling. If a customer buys 50 units at half price but has paid full price before, you've learned they'll buy more, not that their limit is lower.
Keep three columns in your notes: what people said, what they'd pay in a test, and what they paid.
Real Examples of Willingness to Pay in Practice
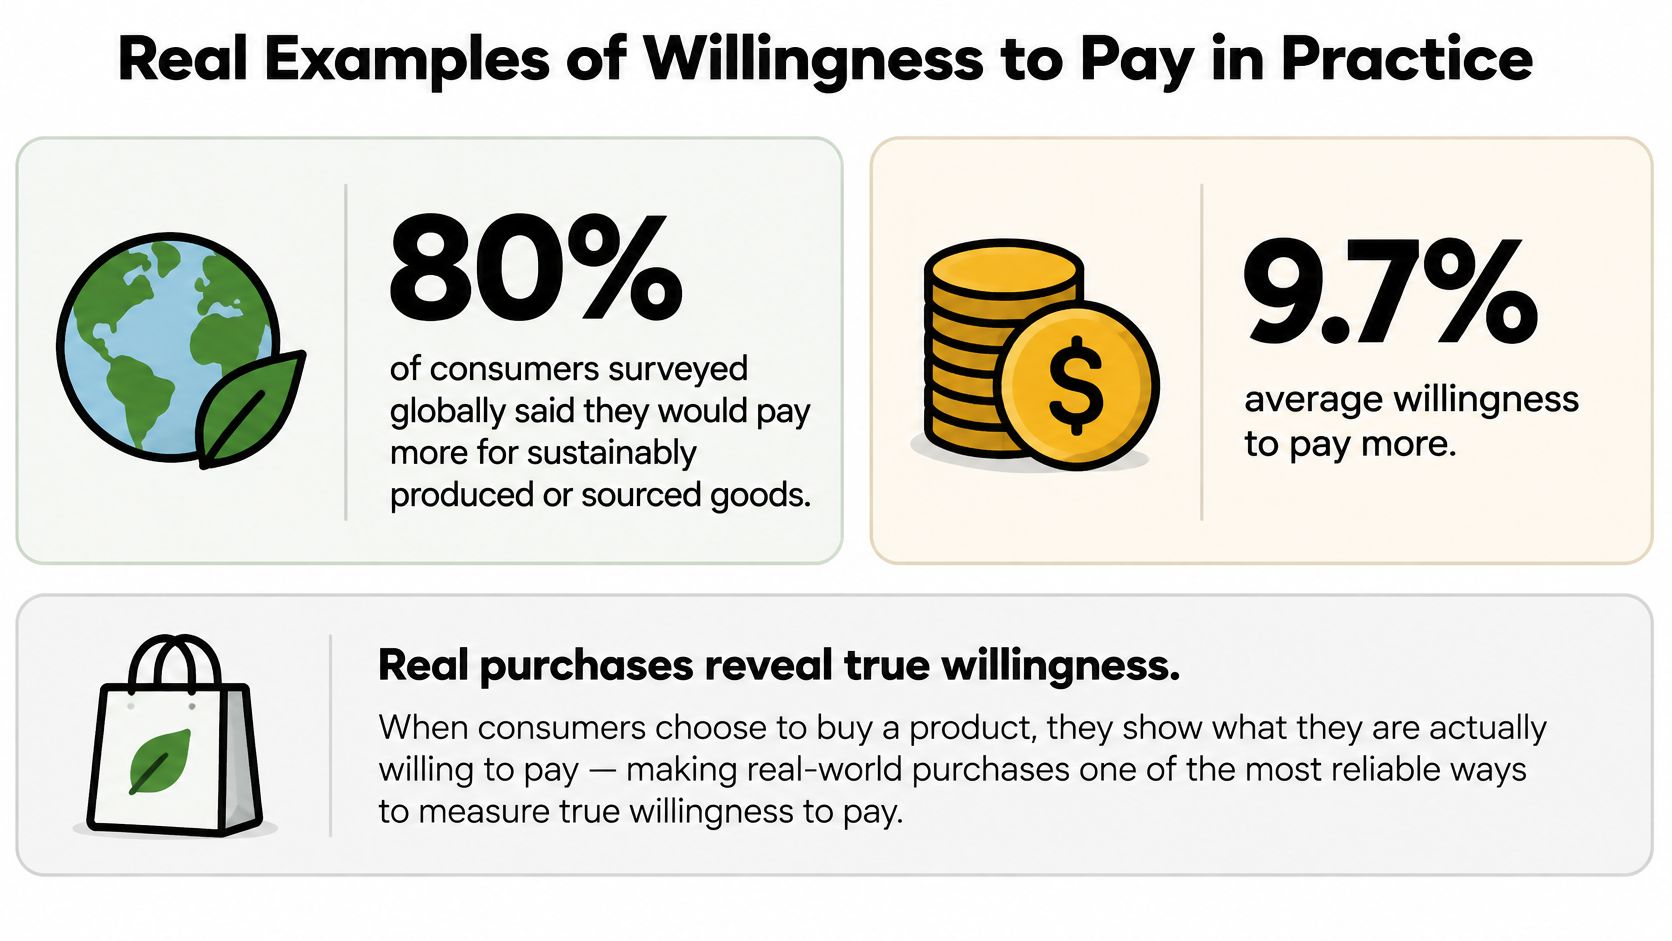
In 2024, PwC's Global Voice of Consumer survey found that 80% of consumers surveyed globally said they were willing to pay more for sustainably produced or sourced goods, with an average willingness to pay 9.7% more. Read that as a statement about what people say they'd accept, not a forecast of what they'll spend. An average also hides the shape: some of those respondents meant 3%, some meant 20%, and a good share would pay nothing once the label sits beside a cheaper alternative on a shelf.
Category moves the baseline more than most product decisions do. A 2024 study of German participants found that 21.43% reported willingness to pay for improved digital-wellbeing features on social media, according to researchers in Frontiers in Computer Science. Same year, a completely different appetite. Sustainability carries a cultural tailwind; a calmer feed does not.
Where a label does the persuading, the effect can be surprisingly steady. A U.S. produce study published in 2025 found that 72% of consumers would pay a premium for food-safety-labelled produce from small farms and 69% for the same label from large farms (PubMed). Close numbers, because the certification carries the value and farm size only nudges it.
Now map your own market's premium ladder. Say a meal-kit brand tests a $2 per box premium for locally sourced ingredients and a $4 premium for the same claim. If the $2 version holds and the $4 version stalls, the useful finding isn't "$2 is our price." It's that this market's ceiling sits somewhere between them, and the next test belongs at $3.
Before you accept any headline statistic about what customers will pay, ask three things:
- Who was asked? A survey of people who already buy the category tells you something different from a survey of the general public.
- What were they asked to pay? A percentage premium and a dollar price produce different answers from the same person.
- What did they buy? If the study never got to a transaction, you're reading intent.
Test Willingness to Pay Before You Set Your Price
Five steps, about a week, and a budget small enough that you'll run them. Our guide to market validation covers how the pieces fit together if you want the wider picture first.
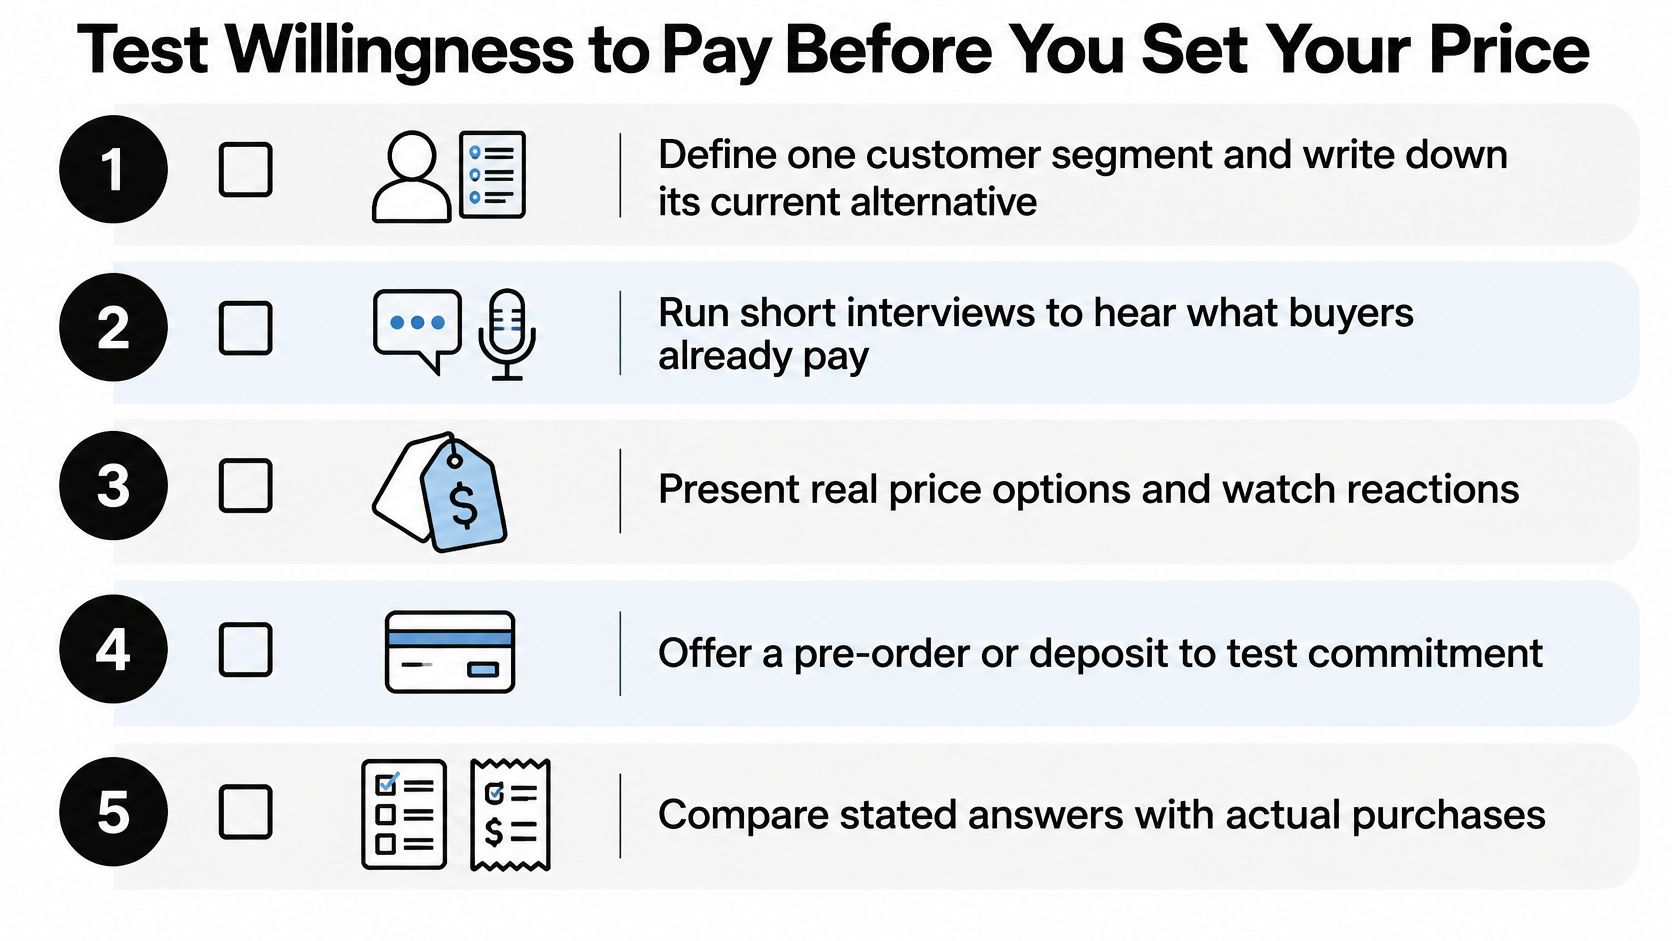
- Pick one segment and name its current alternative. A ceiling is always relative to something the buyer already pays for. Write that alternative down before you write a price.
- Interview six to ten buyers from that segment. Use a Van Westendorp or Gabor-Granger question set to get a candidate range, and don't treat one open-ended "what would you pay?" as data.
- Put two prices in front of strangers. For a SaaS or digital product, we use a landing page with a Stripe checkout for a paid waitlist plus $50 to $150 of paid ads. Two price points inside the range, split by traffic.
- Count payments, not praise. A strong signal is a stranger handing over money or a work email. Upvotes, likes and "keep me posted" don't count.
- Judge the result against your own economics. For a SaaS or digital product, our working signal is 10 strangers paying anything inside 14 days. That's a rule of thumb rather than a research finding, so check it against what it costs you to serve those ten.
If a deposit feels like too much to ask, make it refundable. What you're buying is information, and the buyer's willingness to part with the money is the only part of the answer you can trust.
Two habits make the week easier. Talk to strangers rather than friends, because friends price your feelings instead of your product. And keep the first test cheap enough that a bad result doesn't feel like a verdict on the business, just a reading on one price.
Set the price after real buyers show you where they stop. Not before.
Find Startup Idea collects real pain points from Hacker News and Reddit and pairs each one with the validation test that shows whether anyone will pay for a solution. If you'd rather stop estimating your price from survey answers and start reading it from real checkout behaviour, browse the ideas at Find Startup Idea and put one in front of strangers this week. Their money answers the question their survey answers couldn't.